Successful Investing in the Time of Coronavirus
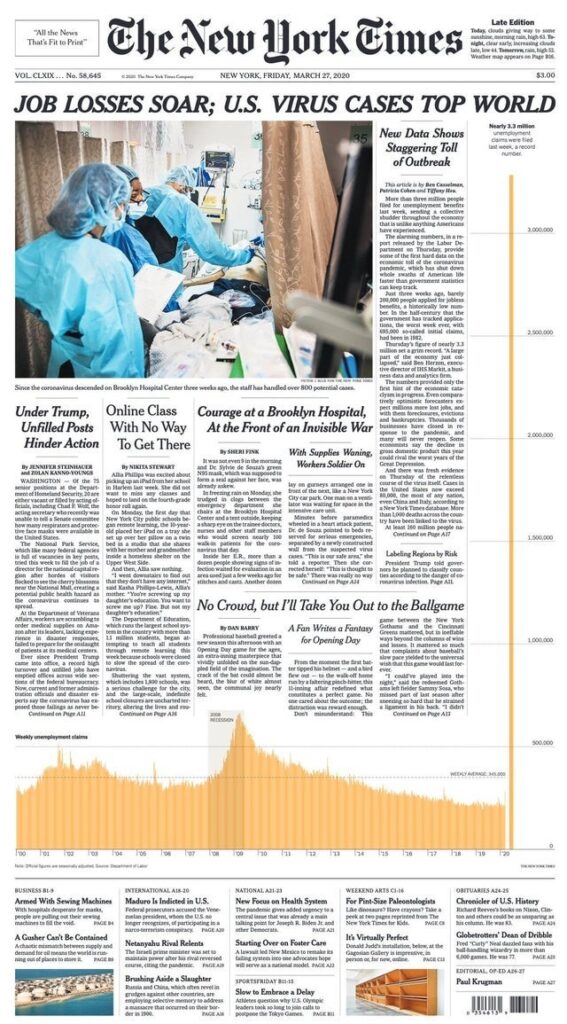
In my last LinkedIn post, I made the case that economic data over the coming weeks and months is going to be shockingly poor, but that doesn’t necessarily mean that market returns will be equally poor. Who knows where market returns will go from here, but our first piece of Coronavirus-impacted economic data is here, and it is astounding. Typically, I’d insert a graph from YCharts or the Federal Reserve, but this data point is so staggering that it made the front page of The New York Times:
This is not a case of artistic exaggeration. The orange bars represent unemployment claims going back to 2000, and last week’s reading was almost five times larger than the previous peak in 2009. Economists expected a record 1.6 million claims and still missed the actual number by half!
Unemployment claims are measured weekly, and as I write this, this week’s reading was just published. An additional 6.6 million people filed for unemployment, tragically shattering last week’s record.
This is clearly unprecedented, but let me try to emphasize just how unprecedented.
Unless you’ve studied some statistics, you may not be familiar with the Greek term “sigma,” but surely you have heard the English translation repeatedly over the past month – volatility. In statistics, we use the term “sigma” to measure volatility, or, more precisely, the amount of variation around an average. Before your eyes glaze over, here’s an example you’ll enjoy: the Dayton Flyers averaged 80 points per game this season, with sigma of 7.9 points. When they destroyed Virginia Tech 89-62, that was statistically a 1-sigma above average offensive game (80 + 7.9 is nearly 89). In a phenomenal offensive game where UD might score 120 points, that’s a 5-sigma above average game (80 + (7.9*5) is nearly 120).
The most recent unemployment claims reading was a 30-sigma event. That’s equivalent to the Flyers scoring 317 points in a game! Dayton was one of the best teams in the country this year, but scoring 317 points is impossible. Similarly, nobody could have imagined a 30-sigma reading in unemployment claims. Or could they? Last Thursday, the day unemployment data was released, the S&P 500 was up 6.2%.* Attributing any given day’s market movement to a single variable is foolhardy (though that doesn’t stop the financial media from doing it daily). Still, the fact that the market was up huge on the worst unemployment claims data in recorded history is telling. It proves that:
- You can’t predict what will happen
- Even if you knew the data ahead of time, you can’t predict the market’s reaction to it
These two things are always true, but in the time of Coronavirus, they are truer than ever. 30-sigma events are so outlandish that our brains cannot even fathom them. The odds that you’ll predict the next one’s occurrence AND the market’s reaction are roughly zero.
Luckily for all of us, successful investing isn’t about predictive skills. Nor is it about intelligence. And since 30-sigma events are one-in-a-lifetime occurrences, unless you live multiple lifetimes, experience isn’t much use either. More than anything, successful investing is about humility. Recognize what you can’t control (short-term market moves), focus on what you can control (savings rate, spending rate, diversification, asset allocation), don’t let your emotions get the best of you, and trust that in time, just like they always have, markets will recover.
*As I write this on 4/2, the S&P 500 is again positive in the midst of the newest unemployment claims data, up 2.3%.

